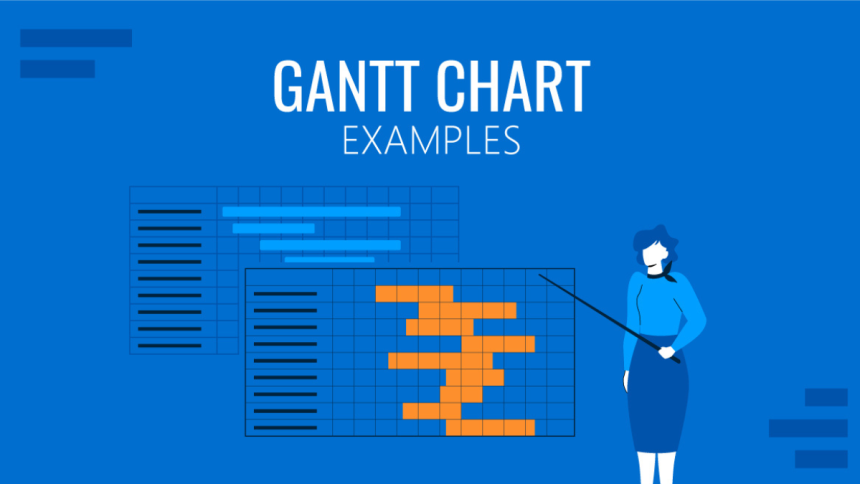
Meeting deadlines, aligning teams, and managing shifting priorities are everyday challenges in project planning. Gantt charts offer an effective way to map out activities, timelines, and dependencies so you can confidently lead a project from concept to completion. Thanks to today’s smart tools like create Gantt charts you can now create Gantt charts in your browser—without needing specialized software or training.
This modern solution combines clarity, speed, and visual polish, making it easier for professionals across industries to stay on top of complex timelines.
Why Every Project Manager Should Create Gantt Charts
Creating Gantt charts allows project teams to visually align every task, milestone, and phase in one place. Whether you’re running a 3-month marketing campaign or managing a 12-month construction schedule, a Gantt chart turns a chaotic list of to-dos into a structured, readable format.
Here’s why smart teams rely on Gantt charts:
- Visual tracking: Know where you are in the plan at any moment.
- Time-bound structure: Set clear start and end dates for all activities.
- Task dependencies: See which steps must be completed before others start.
- Progress updates: Monitor ongoing and completed phases with visual cues.
- Accountability: Assign tasks and deadlines to specific people or teams.
The visual format of a Gantt chart helps cut down on confusion, making it ideal for internal teams, clients, or stakeholders.
Office Timeline Makes Gantt Chart Creation Accessible to Everyone
With Office Timeline Online, you don’t need to be a certified project manager to build a professional chart. The platform offers a simplified approach to project visuals—right in your browser.
Easy to Begin, Easy to Finish
You can start from scratch or use one of many pre-designed templates. Just enter your project’s key tasks, add start and end dates, and the chart takes form automatically. Unlike traditional tools, you don’t have to wrestle with formatting or spreadsheet limitations.
Highly Customizable Gantt Charts
Every part of your Gantt chart can be customized. Adjust time scales (days, weeks, months), apply color codes, group tasks, or create swimlanes. You can even show dependencies between tasks and highlight critical milestones in bold or colored markers.
The drag-and-drop interface also makes real-time edits simple. Whether the project expands or shifts direction, your chart is easy to update and share.
Designed for Communication
Many users create Gantt charts not just for tracking—but for presenting. Office Timeline Online allows you to export your visuals into PowerPoint or image formats, ensuring every update is presentation-ready. Plus, you can share web-based versions with anyone, even if they don’t have an account.
Who Should Create Gantt Charts—And When?
Gantt charts aren’t reserved for IT or engineering teams anymore. Today, anyone leading or coordinating tasks can benefit from them—from freelancers to corporate leaders.
Popular Use Cases:
- Product Teams: Visualize go-to-market strategies and rollout plans
- Marketing Departments: Schedule campaigns, assets, and launch phases
- Educators & Students: Manage research timelines or academic milestones
- Consultants: Present phased deliverables to clients with clarity
- Nonprofits & NGOs: Coordinate event planning or fundraising timelines
- Event Planners: Keep track of vendors, logistics, and deadlines
Creating Gantt charts helps make sure each phase of a plan is covered—whether it’s a solo task list or a complex team project with dozens of moving parts.
Why Office Timeline Is a Smarter Gantt Chart Creator
Office Timeline Online delivers what most spreadsheet templates or heavyweight project tools can’t: clarity, elegance, and efficiency. Here’s why professionals love using it:
- No downloads required – access from anywhere via web
- Excel-friendly – import task data quickly without starting over
- Presentation-grade output – looks great in meetings and reports
- Professional templates – save time and stay consistent
- Real-time editing – update project visuals as soon as plans shift
- Multiple sharing options – download as slides, images, or live web links
You don’t need advanced tools to manage projects like a pro—you just need a platform that’s built for clarity and speed.
Conclusion: Create Gantt Charts That Drive Progress
A Gantt chart is more than a timeline—it’s a visual map of your project’s success. By helping you identify phases, track deadlines, and align your team, it transforms project management from guesswork into strategy.
With Office Timeline’s online Gantt chart maker, creating these visuals is easier than ever. Whether you’re preparing for a team briefing or planning your next major milestone, you can create Gantt charts that inspire clarity, direction, and on-time delivery.
Don’t let disorganization delay your goals. Start building your next project timeline with Office Timeline—and keep everything (and everyone) on track.
Lynn Martelli is an editor at Readability. She received her MFA in Creative Writing from Antioch University and has worked as an editor for over 10 years. Lynn has edited a wide variety of books, including fiction, non-fiction, memoirs, and more. In her free time, Lynn enjoys reading, writing, and spending time with her family and friends.


