

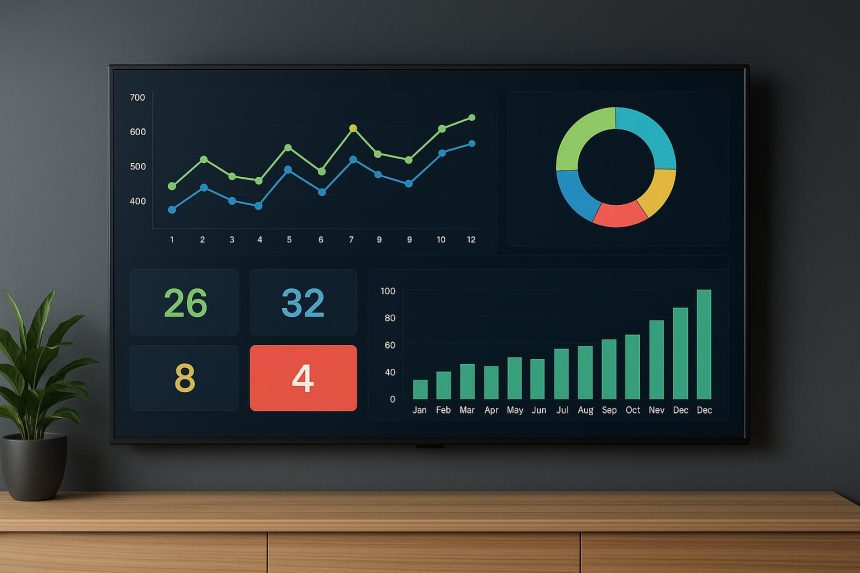
A TV dashboard display is a screen that shows a team’s live numbers, sales, support tickets, and delivery status on a display everyone can see, refreshed automatically. Businesses use them to put the same information in front of a whole team at once, without anyone needing to open a report or join a call.
The problem with dashboards nobody opens
Most business data already sits in a dashboard somewhere. The catch is that someone has to log in and look. Reports get checked by the few people whose job is to check them, and everyone else works without the numbers in view. The information exists but does not circulate.
What changes when the screen is shared
Putting the dashboard on a wall display removes the login barrier. The numbers are present in the room all day, and the sales team sees the target and better understands what they must to to accomplish it. The support team sees the queue building before it becomes a backlog. A warehouse sees the day’s orders against the clock. The data shapes behaviour because it’s readily available to team members.
The effect is less about the chart and more about attention. A figure on a shared screen gets noticed in passing, questioned, and acted on. The same figure inside a report waits for a meeting.
Which teams use them, and for what
Different teams put different numbers on the wall. A sales team shows revenue against target and the leaderboard. A support team shows open tickets, response time and customer satisfaction. Operations show output, delivery status or days without an incident. Finance shows cash position and overdue invoices. The common thread is a number that changes through the day and means something to everyone who can see it. A static figure that updates monthly belongs in a report. A live figure that moves with the work belongs on a screen.
What makes a wall dashboard actually work
A dashboard on a wall fails the moment it goes stale. If the figure is yesterday’s, people learn to distrust the screen and stop looking. The display has to pull from the live source and refresh on its own, with no one remembering to update it. That means connecting the screen to the tool where the data already lives, whether a business intelligence platform, a spreadsheet or a sales system, and letting it flow through automatically.
What it takes to set one up
A live dashboard needs three things: a data source, a display, and a way to push the view to the screen and keep it current. Digital signage platforms handle the last part, pulling a dashboard or a set of metrics onto one or many screens and refreshing them on a schedule:
The value of putting your data where people can see it
At the end of the day, a live, on-screen dashboard is about making sure the right information is in front of the right people at the right time. When live metrics are visible throughout the day, teams don’t have to wait for meetings or dig through reports to understand what’s happening. They can spot issues sooner, celebrate progress as it happens, and make better decisions in the moment. That’s why more businesses are moving their dashboards out of browser tabs and onto the wall.

Lynn Martelli is an editor at Readability. She received her MFA in Creative Writing from Antioch University and has worked as an editor for over 10 years. Lynn has edited a wide variety of books, including fiction, non-fiction, memoirs, and more. In her free time, Lynn enjoys reading, writing, and spending time with her family and friends.