

Let’s say you have two funds in front of you. Both have potential. The only difference is that one rises slowly and calmly. And the other shakes and jumps like an old bus on a rough road. You understand what we mean, right? Great.
Probably, you are now wondering which one is the best fit for you to invest in. Well, you need to understand the synthetic risk and reward indicator. This will save you from nasty surprises. Read through this article to learn more.
Why Risk Labels Matter
As a new investor, you may feel the thrill that comes with chasing profits. But the ride can really shake you up. Your fund might gain 8% a year and lose 20% one day. This drop is the one that makes many traders sell at the worst time.
With the synthetic risk and reward indicator and additional resources, you can understand this risk up front. So, you know what to expect before you invest.
Where the SRRI Came from
Europe brought in the SRRI under its UCITS rules after the Committee of European Securities Regulators issued guidelines in 2010. The major reason behind this is that regular investors found fund documents hard to read. One simple number made funds easier to compare.
If you look up the synthetic risk and reward indicator Investopedia or synthetic risk and reward indicator wiki page, this is the story behind it.
Behind the Number: The Calculation
Have you ever heard of standard deviation? We are sure you have. This is what the synthetic risk and reward indicator calculation relies on. It simply shows the amount of returns that swing around the average.
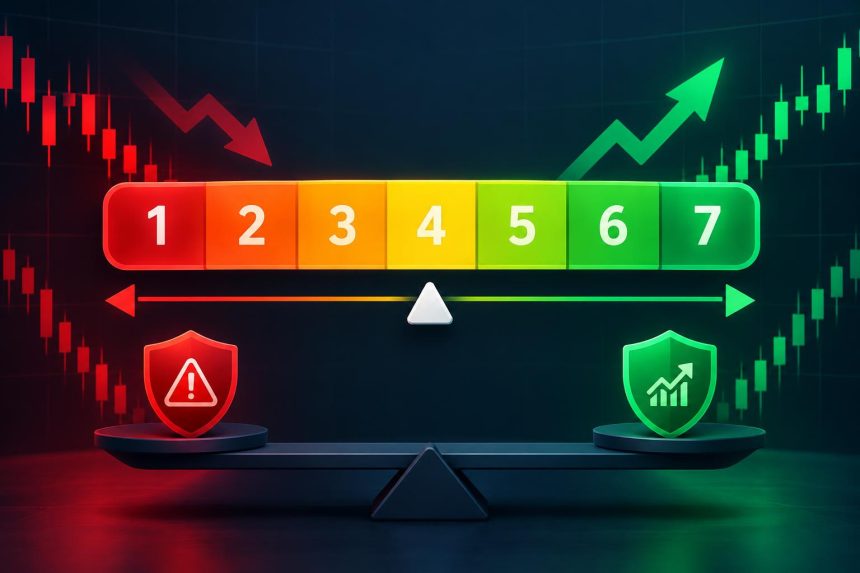
The process is quite simple. You just need to take five years of weekly returns, annualize them, and then place a fund in a volatility band. When it goes below 0.5%, you get a 1. And when it goes above 25%, you get a 7. The bands in between climb step by step.
How to Read the 1–7 Scale
Picture this: you are in front of a staircase. Step 1 is the bottom, where prices barely move, like money market funds. Step 4 means medium ups and downs, which balanced funds often show. And steps 6 and 7 are the bumpy ones, which are usually the emerging market stock or commodity funds.
According to the synthetic risk and reward indicator definition, a big number does not promise better returns. It just means results can swing wider, up or down.
Misconceptions Involving the Synthetic Risk & Reward Indicator
As an investor, you might make a few mistakes in this field. Sometimes, you might think that level 1 is the simplest and comes with 0 risks. This is not the case; any level comes with its own risks.
It is also wise to note that the synthetic risk and reward indicator is not a prediction. It only looks back at past ups and downs.
Pick a Risk Level That Suits You
How long can you leave your money alone? How big a drop can you handle calmly? Short-term plans fit lower numbers; long-term plans suit higher ones. Also, check that your fund documents show the synthetic risk and reward indicator, not the newer PRIIPs scale.
Conclusion
The synthetic risk and reward indicator will not make you a pro trader. It stops you from investing in the dark. It is one number derived from five years of price swings. Check it before your next trade and then consult a licensed adviser.

Lynn Martelli is an editor at Readability. She received her MFA in Creative Writing from Antioch University and has worked as an editor for over 10 years. Lynn has edited a wide variety of books, including fiction, non-fiction, memoirs, and more. In her free time, Lynn enjoys reading, writing, and spending time with her family and friends.